
8.4 KiB
🚀 Ghaymah SRE Practical Exam
Candidate Name: Ahmed Abdelaziz Hussein
Track: Site Reliability Engineering (SRE)
📁 Repository Structure
Below is the directory tree of the submission, showing all implementation files:
.
├── common-qabilah
│   └── qabilah-profile.txt
├── q1-deploy-monitor
│   ├── Dockerfile
│   ├── dashboard.html
│   ├── health-check.sh
│   └── status.json
├── q2-postmortem
│   └── postmortem-report.md
├── q3-cicd
│   └── workflow.yml
├── q4-sacalability
│   ├── architecture.png
│   └── calculations.md
└── q5-mithal-monitor
    ├── dashbourd.html
    ├── metrics.json
    └── monitor.py
🔧 Technologies Used
The project leverages the following technologies and frameworks:
- Go / Fiber (API Development)
- Docker (Containerization & Multi-stage builds)
- GitHub Actions (CI/CD Pipeline)
- HTML / CSS / JavaScript (Dashboards & Visualization)
- Python (Mithal Automated Monitoring)
- Bash (Monitoring Agent scripts)
- Ghaymah Cloud (Deployment Infrastructure & CLI)
📊 Question 1 – Deploy Application & Monitoring
Requirements Covered
| Requirement | Status | Details |
|---|---|---|
| Dockerfile | ✔ | Optimized multi-stage build starting from golang:alpine to scratch |
| Simple Go Fiber API | ✔ | REST API utilizing the Go Fiber framework |
/health endpoint |
✔ | Returns application health status and current timestamp |
/metrics endpoint |
✔ | Exposes real-time internal metrics (uptime, request count, latency) |
| Monitoring Script | ✔ | Bash script performing periodic checks and exporting metrics to JSON |
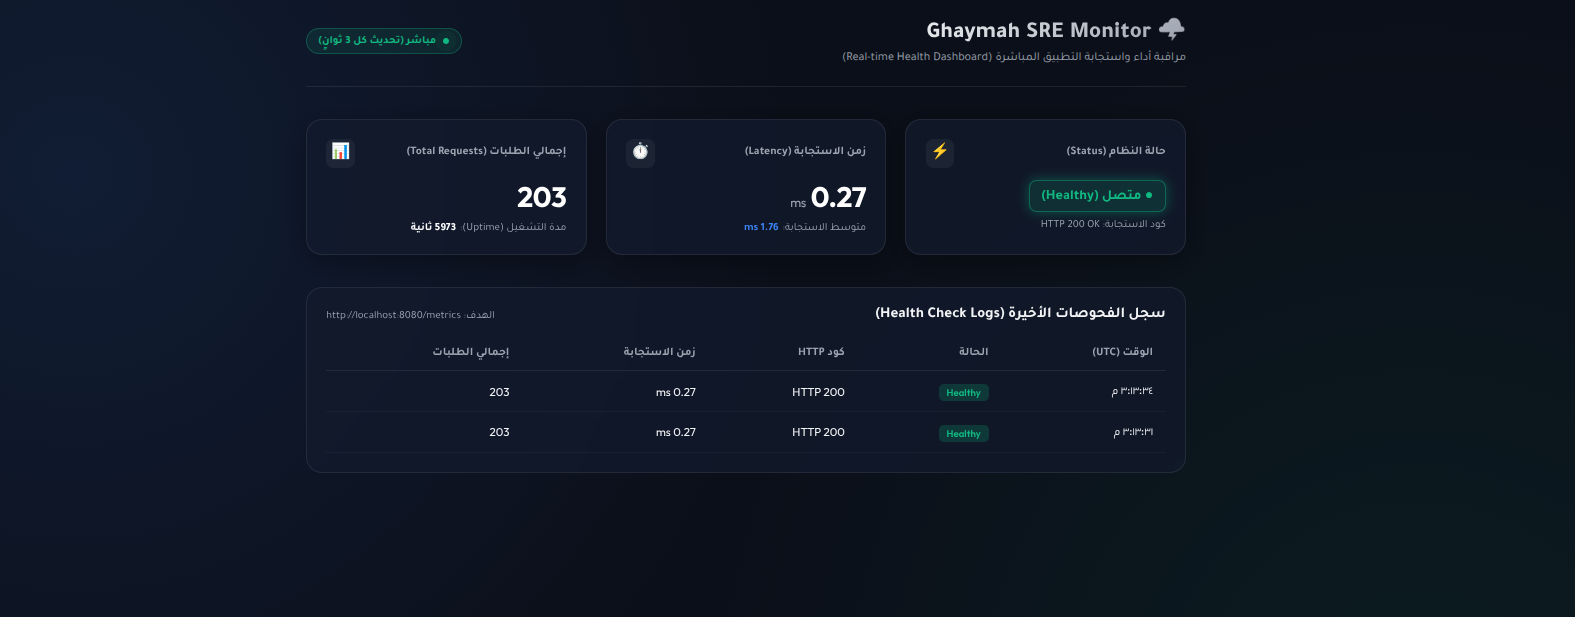
| Monitoring Dashboard | ✔ | Static HTML dashboard to display real-time statuses and metrics |
| Deployment on Ghaymah Cloud | ✔ | API deployed live on Ghaymah systems |
Files
q1-deploy-monitor/Dockerfileq1-deploy-monitor/health-check.shq1-deploy-monitor/dashboard.htmlq1-deploy-monitor/status.json
Proof of Implementation
The screenshots showcasing the running state are located under docs/screenshots/:
-
Deployment on Ghaymah Cloud

-
Monitoring Script Running

-
Dashboard


📑 Question 2 – Incident Postmortem
Requirements Covered
- Executive Summary (Incident metadata, downtime duration, root cause, impact)
- Timeline (Detailed chronological sequence of events from spike to resolution)
- Root Cause Analysis (RCA) (Detailed diagnosis of resource limits and missing HPA)
- Recommendations (Immediate P0 fixes and long-term action items)
- Auto Scaling Policy (Configured Horizontal Pod Autoscaler YAML config for Ghanimah)
- Monitoring Strategy (Prometheus alert rules for early warning and OOM checks)
Files
⚙️ Question 3 – CI/CD Pipeline
Requirements Covered
- Docker Build: Builds container images on triggers.
- Container Registry: Image tagging for version control.
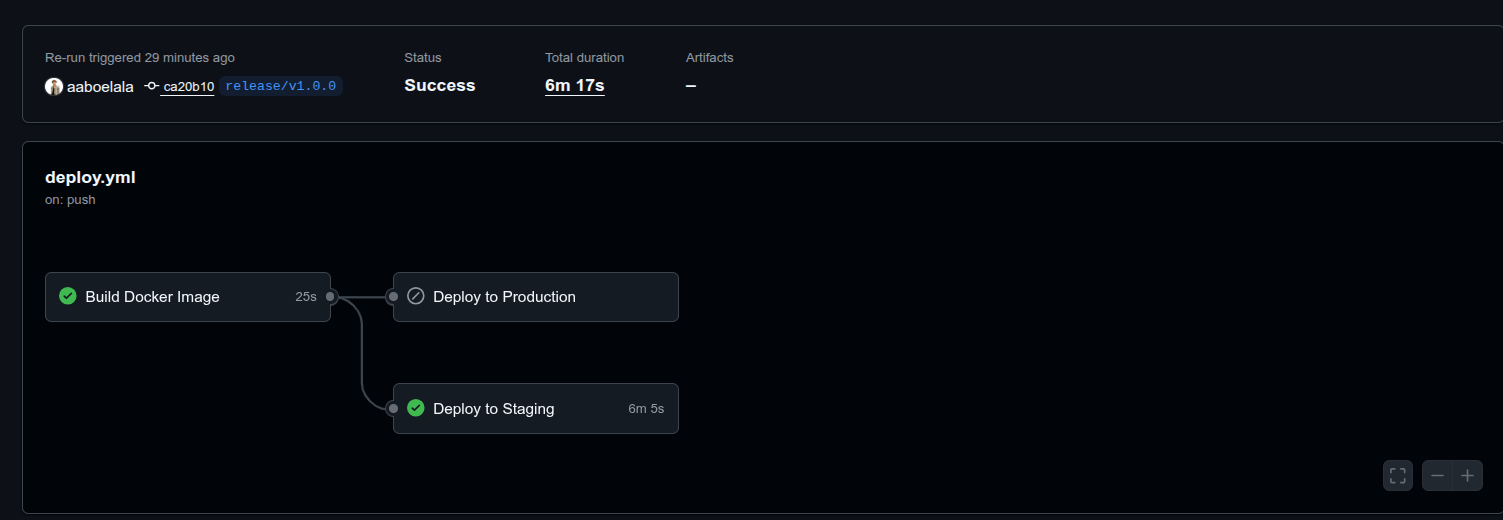
- Deploy to Staging: Triggered automatically on release branches.
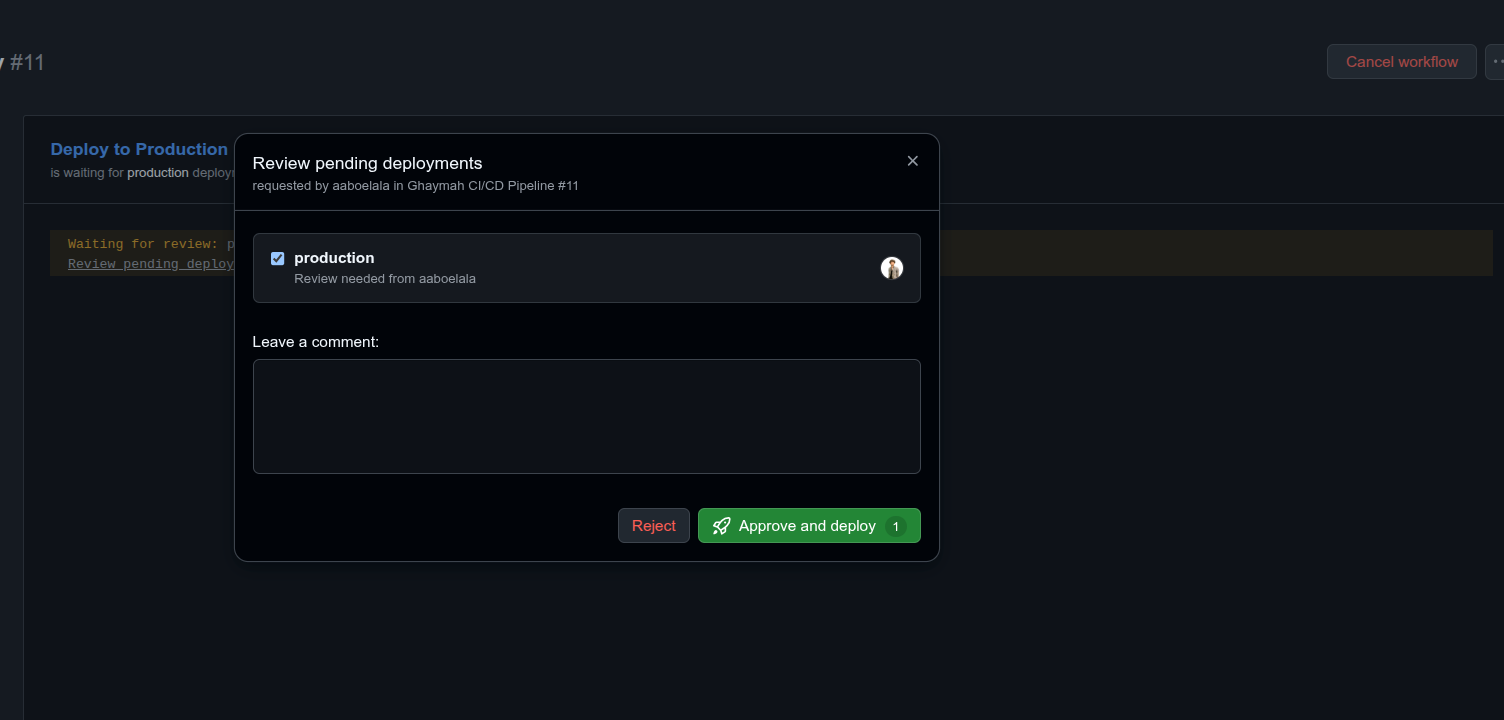
- Manual Approval: Gatekeeping promotion using GitHub Environments rules.
- Deploy to Production: Triggered on main branch post-approval.
- Ghaymah CLI Integration: Automated login and app launch in workflow jobs.
Deployment Flow Diagram
Push
  ↓
Build
  ↓
Deploy Staging
  ↓
Manual Approval
  ↓
Deploy Production
Files
Proof of Implementation
-
Staging Deployment
-
Manual Approval


📈 Question 4 – Scalability & Load Balancing
Requirements Covered
- Architecture Diagram (Visual flow of requests to handle 15,000 req/s across zones)
- Capacity Calculation (Calculations justifying 39 Pods based on limits and 30% safety buffer)
- Cold Start Strategy (Multi-stage scratch image design, pre-warming, and probe tuning)
- Block Storage (Dynamic PV/PVC configurations utilizing Ghanimah Block Storage NVMe disks)
Files
🖥️ Question 5 – Mithal Monitoring Dashboard
Requirements Covered
- Latency Monitoring: Measures and logs home page loading speeds.
- Uptime Monitoring: Tracks availability and monitors return status codes.
- SSL Monitoring: Calculates certificate expiration and counts remaining days.
- DNS Monitoring: Resolves and logs lookup times.
- Search Response Monitoring: Assesses specific query parameters response time.
- JSON Storage: Logs state to dynamic history files up to 24 hours.
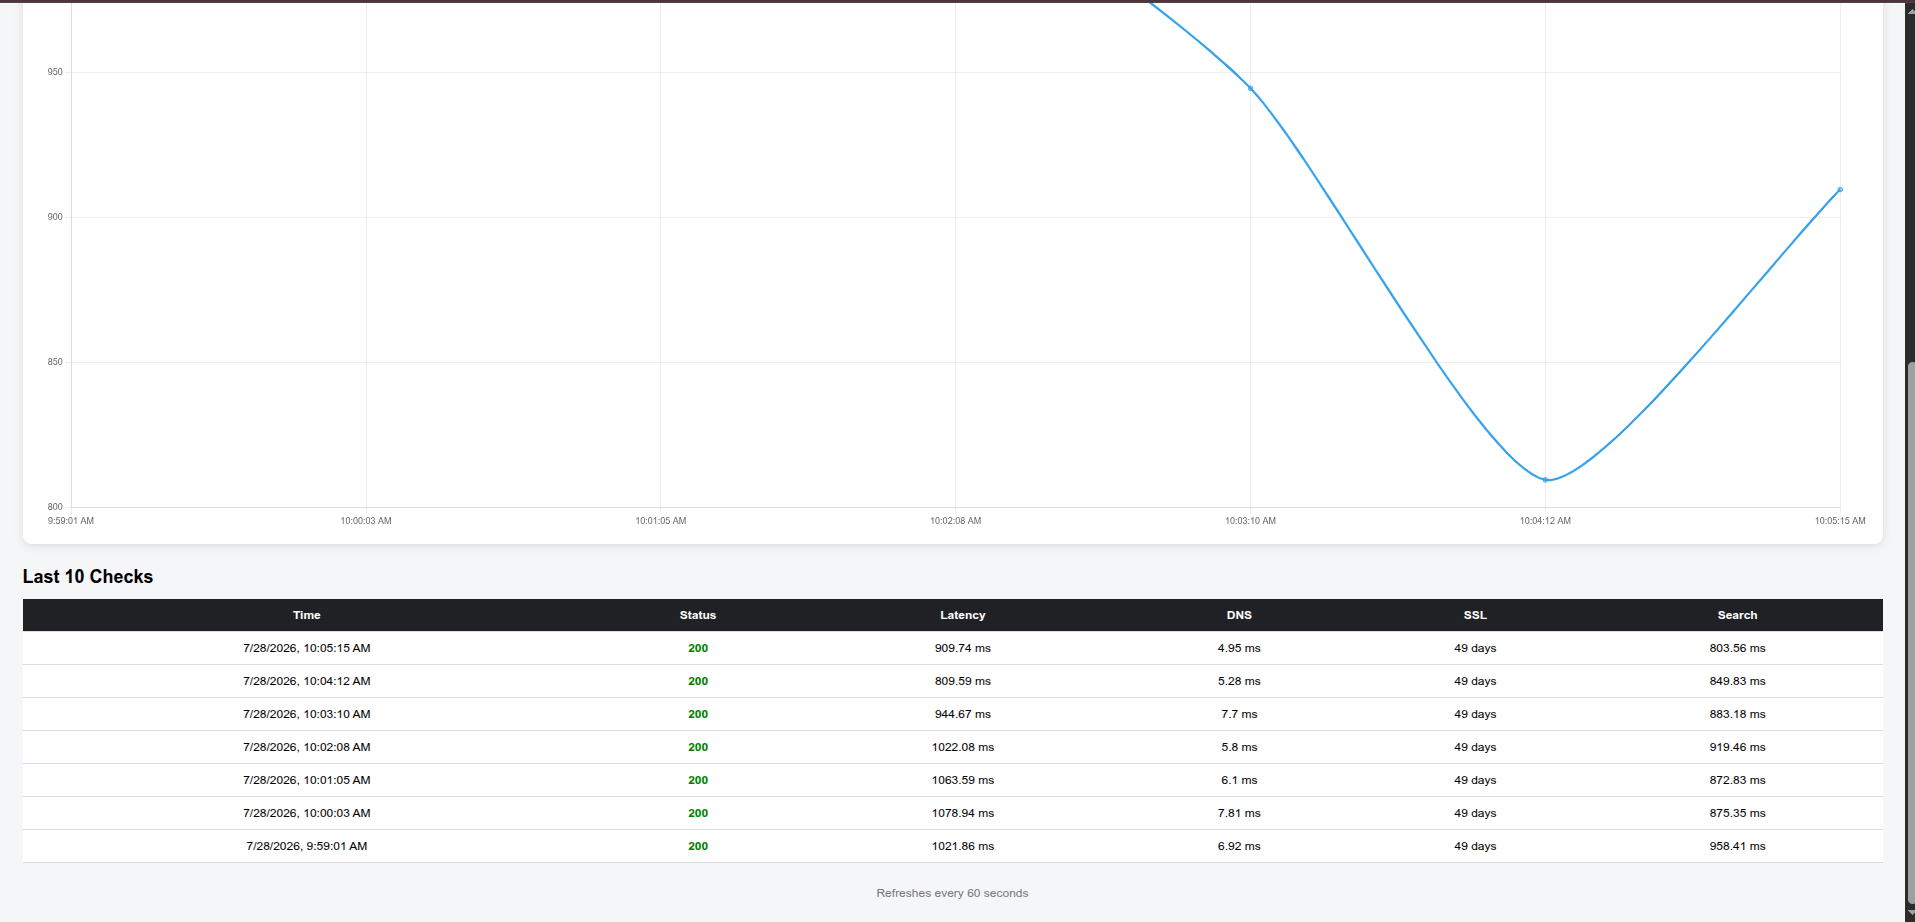
- Dashboard: An interface displaying key charts and status panels.
- Deployment on Ghaymah: Live monitor configuration on Ghaymah infrastructure.
Files
Proof of Implementation
-
monitor.py Running

-
Dashboard


🏃 Running Locally
Question 1 – Go API & Monitoring Agent
To test the Go Fiber API and the monitoring scripts locally:
- Build and Run the Go API via Docker:
# Build the container image docker build -t ghaymah-sre-api ./q1-deploy-monitor # Run the container exposing port 8080 docker run -d -p 8080:8080 --name ghanimah-api ghaymah-sre-api - Run the Bash Monitoring Agent:
# Point the agent to the locally running Docker container API_URL=http://localhost:8080 bash q1-deploy-monitor/health-check.sh - View the Dashboard:
Open
q1-deploy-monitor/dashboard.htmldirectly in a web browser of your choice.
Question 5 – Mithal Automated Monitor
To test the Python monitoring daemon locally:
- Install Dependencies:
pip install requests - Run the Monitor Script:
python3 q5-mithal-monitor/monitor.py - View the Mithal Dashboard:
Open
q5-mithal-monitor/dashbourd.htmlin your browser to view historical metrics.
✨ Project Highlights
This repository demonstrates complete implementation of fundamental Site Reliability Engineering practices:
- Containerization: Clean multi-stage lightweight builds (Go statically-linked binary in a
scratchcontainer). - Monitoring & Observability: Real-time metrics gathering, system state logging, alerts modeling, and custom front-end status dashboards.
- CI/CD: Automated builds, environments targeting, manual approvals, and deployment orchestrations.
- Incident Analysis: Professional blameless postmortem report detailing timelines, root cause analysis, action items, auto-scaling thresholds, and early discovery strategies.
- Scalability: Quantitative capacity sizing for high-traffic environments (15,000 req/s), Cold Start tuning, and stateful volume management.
- Cloud Deployment: Orchestration using the Ghaymah Cloud platforms.
✍️ Author
Ahmed Abdelaziz Hussein
Information Systems
Faculty of Computers and Information
Qabilah Profile: ahmed-abdelaziz-89943a271